
Figure 2.
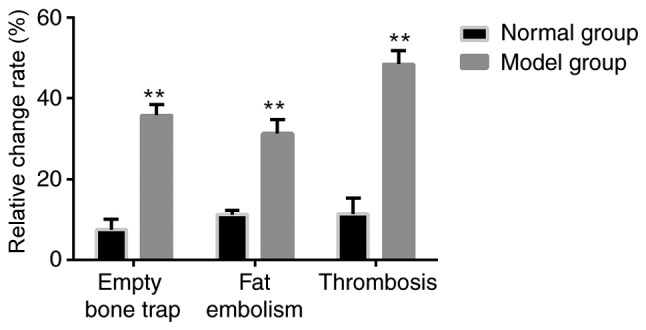
Proportion of empty bone, fat emboli and thromboembolism were compared between the groups. Using the stained tissue, the proportion of empty bone, fat emboli and thromboembolism was determined in the normal and model groups. **P<0.05 vs. normal group.