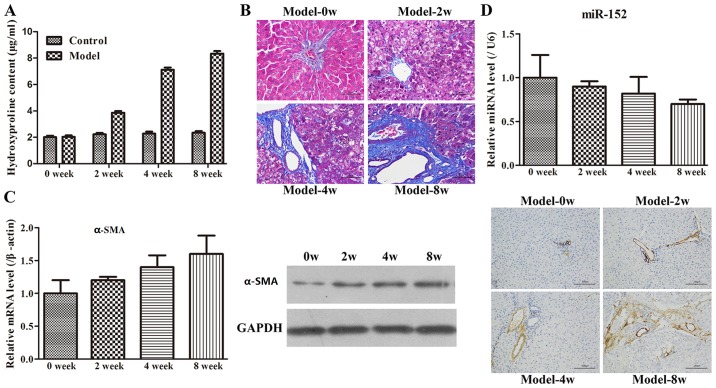
Figure 2.
Rat model of liver fibrosis is constructed by administrating carbon tetrachloride. (A) Liver hydroxyproline content was determined to estimate collagen content and expressed as µg hydroxyproline per mg liver tissue (wet weight). The values are expressed as the mean ± SD. (B) Changes in the liver tissues of rats at different time points following modelling were visualized using haematoxylin-eosin and Masson staining (magnification, ×200). (C) RT-qPCR examination, western blot analysis and immunohistochemistry staining of liver tissues were performed with α-SMA specific-primers and antibodies. Data in the bar graphs are presented as the mean ± SD. (D) Hepatic expression level of miR-152 was measured by RT-qPCR. The relative levels of miR-152 were normalized against U6 in the same samples. SD, standard deviation; RT-qPCR, reverse transcription quantitative polymerase chain reaction; miR, microRNA; α-SMA, α-smooth muscle actin.

