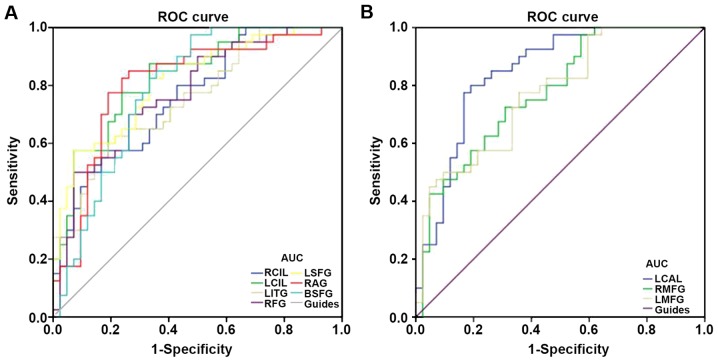
Figure 3.
ROC curve analysis of the mean ALFF values for altered brain regions. (A) The area under the ROC curve for the RCIL was 0.760 (P<0.001; 95% CI, 0.650–0.862), that for the LCIL was 0.828 (P<0.001; 95% C,: 0.741–0.915), that for the LITG was 0.754 (P<0.001; 95% CI, 0.651–0.857), that for the RFG was 0.771 (P<0.001; 95% CI, 0.670–0.872), that for the LSFG was 0.812 (P<0.001; 95% CI, 0.721–0.904), that for the RAG was 0.807 (P<0.001; 95% CI, 0.708–0.906) and that for the BSFG was 0.785 (P<0.001; 95% CI, 0.684–0.885) [CUs>HCs]. (B) The area under the ROC curve was 0.848 (P<0.001; 95% CI, 0.763–0.933) for the LCAL, while that for the RMFG was 0.778 (P<0.001; 95% CI, 0.679–0.877) and that for the LMFG 0.773 (P<0.001; 95% CI, 0.674–0.873) [CUs<HCs]. ALFF, amplitude of low-frequency fluctuation; HCs, healthy controls; CU, corneal ulcer; ROC, receiver operating characteristic; RCIL, right cerebellar inferior lobe; LCIL, left cerebellar inferior lobe; LITG, left inferior temporal gyrus; RFG, right fusiform gyrus; LSFG, left superior frontal gyrus; RAG, right angular gyrus; BSFG, bilateral superior frontal gyrus; LCAL, left cerebellar anterior lobe; RMFG, right middle frontal gyrus; LMFG, left middle frontal gyrus.

