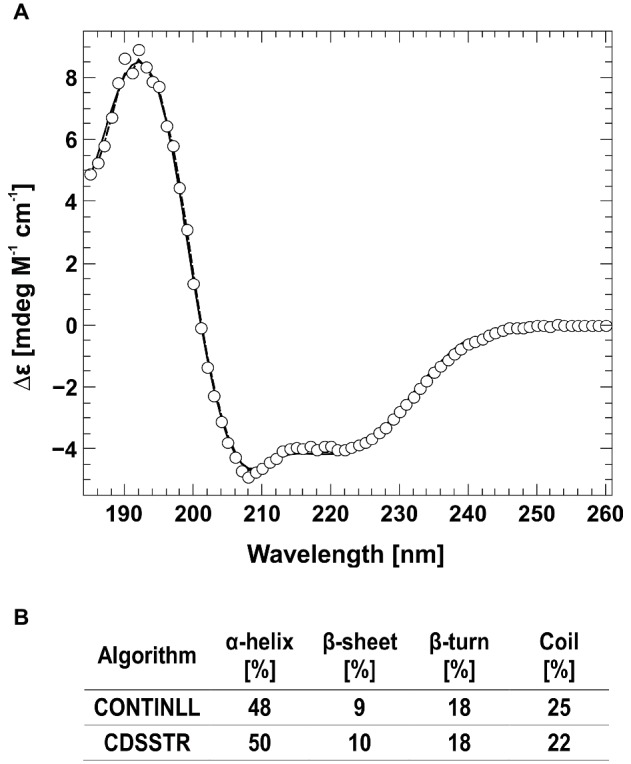
Figure 2.

Circular dichroism spectra of AtETR2. (A) The far-UV spectra of AtETR2 was calculated and adjusted to molar extinction (∆ɛ) considering molecular weight and protein concentration of AtETR2. (B) Secondary structure content was calculated by CONTINLL (solid line) and CDSSTR (dashed line) from the CDpro software package.
