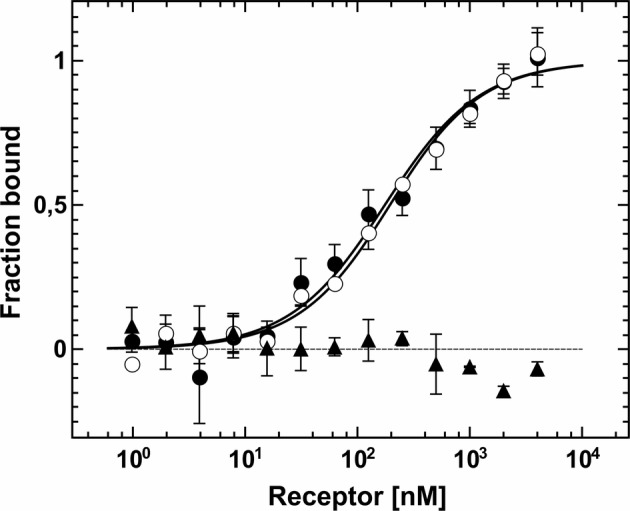
Figure 5.

MST based protein-protein interaction assay between AtCTR1 and receptor proteins AtETR1 and AtETR2. Binding of AtETR1 to fluorescently labeled AtCTR1 measured by MST resulted in a Kd value of 169(15) nM (○). For AtCTR1-AtETR2 complex formation a Kd value of 165(20) nM was obtained (●). As negative control, titration of chemically denatured AtCTR1 with AtETR2 is shown. Here, no binding event was observed (▲). Data are given as the mean (SD) of independent triplicates (●, ○) and duplicates (▲), respectively.
