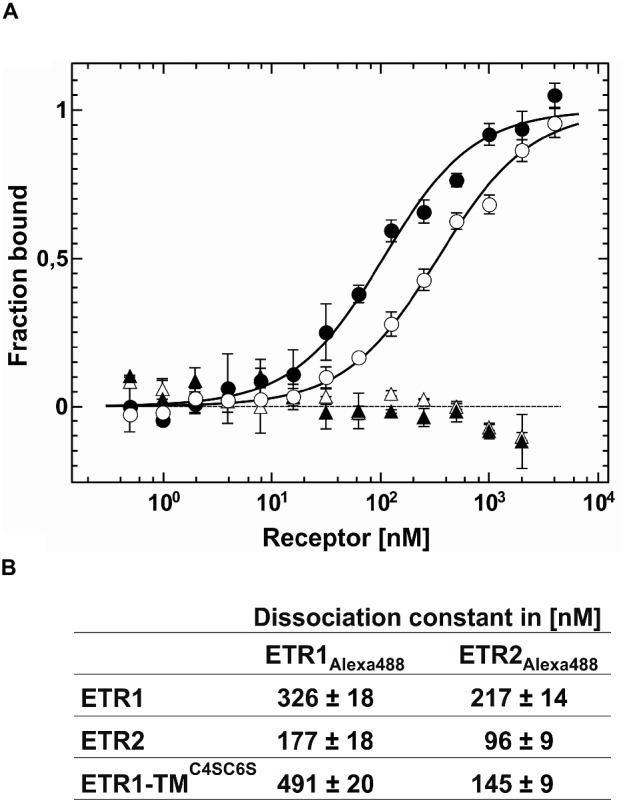
Figure 6.

Quantification of receptor-receptor interactions by microscale thermophoresis. (A) For the homomeric AtETR1-AtETR1 complex formation a Kd value of 326(18) nM (○) was obtained. As negative control chemically denatured AtETR1 was used showing no binding event (△). From the binding curve of the homomeric AtETR2-AtETR2 complex a Kd value of 96(18) nM (●) was calculated. Chemically denatured AtETR2 indicates no interaction of the binding partners (▲). All data represent the mean (SD) of independent triplicates (○, ●) and duplicates (△, ▲). (B) Summary of the dissociation constants Kd for receptor-receptor interactions obtained by MST, also see Supplementary Figure S3. All data represent the mean (SD) of three independent measurements.
