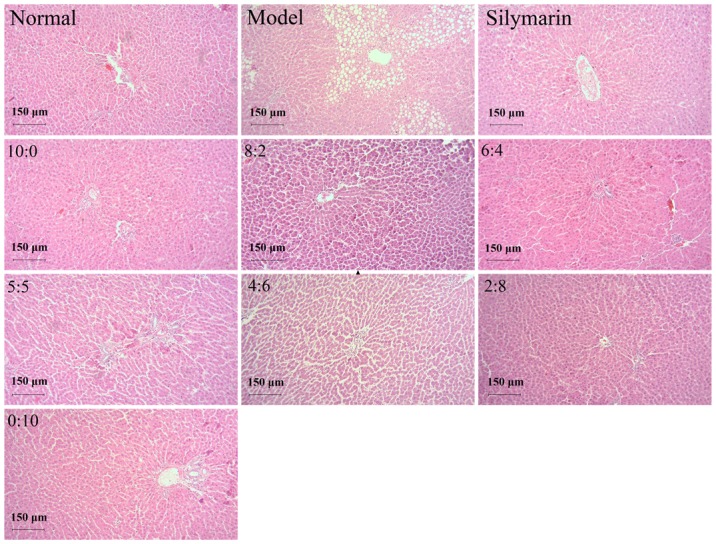
Figure 1.

Histopathological photomicrographs of liver samples from the normal control, model and 22.75 mg/kg silymarin groups and those treated with different ratios of 18α- and 18β-glycyrrhizic acid (10:0, 8:2, 6:4, 5:5, 4:6, 2:8 and 0:10; 10.83 mg/kg) (hematoxylin and eosin staining; magnification, ×100; scale bar, 150 µm).
