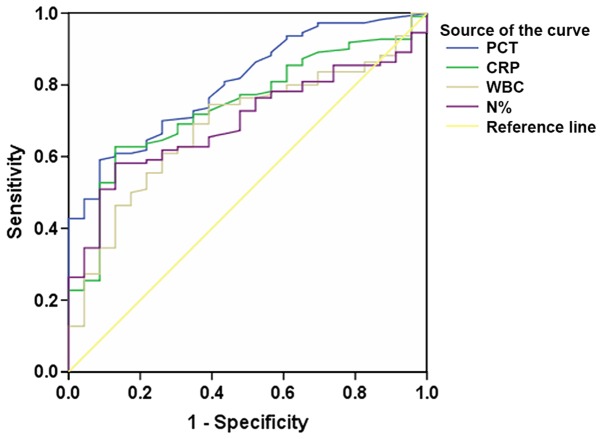
Figure 2.
Receiver operating characteristic curves using PCT, CRP, WBC and N% to predict local infection of patients with type 2 diabetes mellitus. AUCs of PCT and CRP were higher compared with WBC and N% therefore, PCT and CRP had better diagnostic efficacy for local infection compared with WBC and N%. PCT, procalcitonin; CRP, C-reactive protein; N%, neutrophil percent; WBC, white blood cells; AUC, area under the curve.

