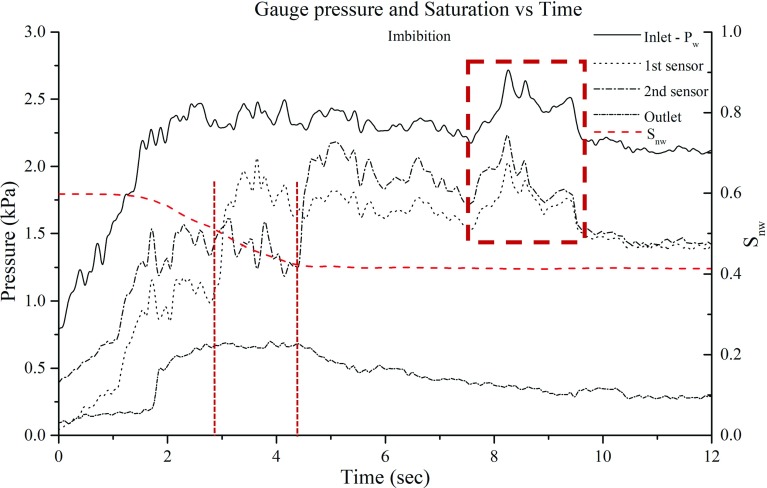
Fig. 11.
Evolution of pressure and non-wetting phase saturation over time at the four measurement locations during imbibition. The red rectangular indicates the peak in pressure caused as the wetting phase invades two bottleneck pores shown in Fig. 10d

