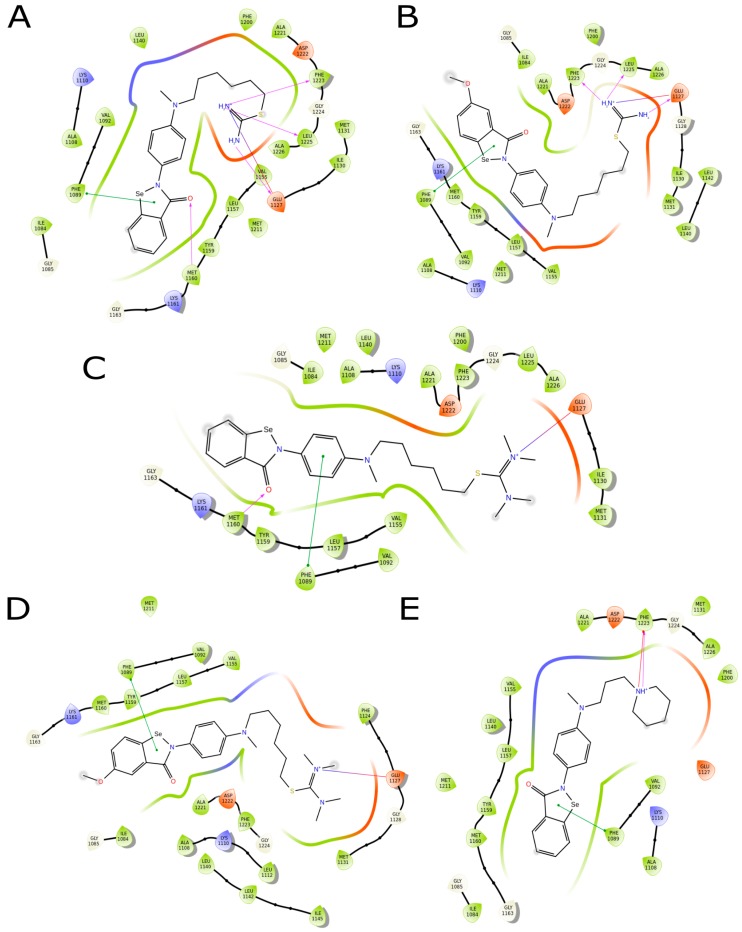
Figure 5.
The binding mode of compounds in the ATP binding pocket of c-Met protein in two-dimensional panel. The green full line indicates the π–π stacking interaction, the purple arrow indicates the hydrogen bond and the fuchsia line indicates the ionic bond. The grey shade highlights the solvent exposure region of the small compounds. (A) The binding mode of compound 7a. (B) The binding mode of compound 7b. (C) The binding mode of compound 8a. (D) The binding mode of compound 8b. (E) The binding mode of compound 12c.

