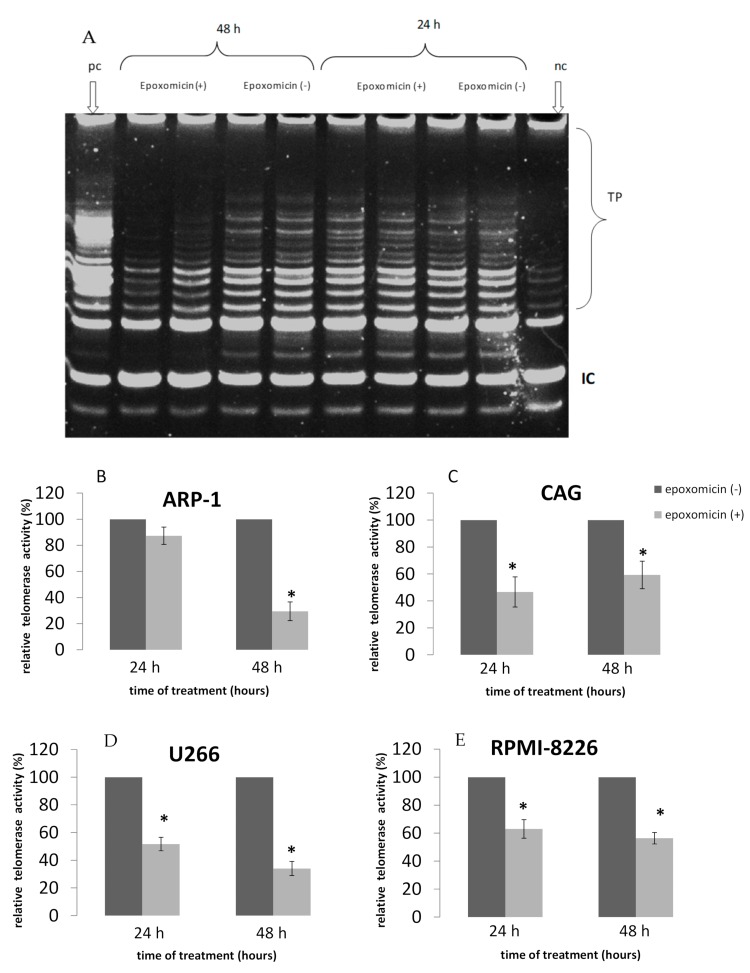
Figure 3.
TA of MM cells in response to epoxomicin. MM cells were grown in the presence of the IC50 of epoxomicin for 24 and 48 h and telomerase activity was assessed by the TRAP assay. (A) A representative example of the TRAP assay. TP—telomerase products; IC—internal PCR control; PC—positive control (a mixture of six templates competent for amplification by the primers of the TRAP assay); NC—negative control—no telomerase extract in the reaction. (B) ARP-1 cells; (C) CAG cells; (D) U266 cells; (E) RPMI-8226 cells. * denotes statistical significance (p < 0.05).

