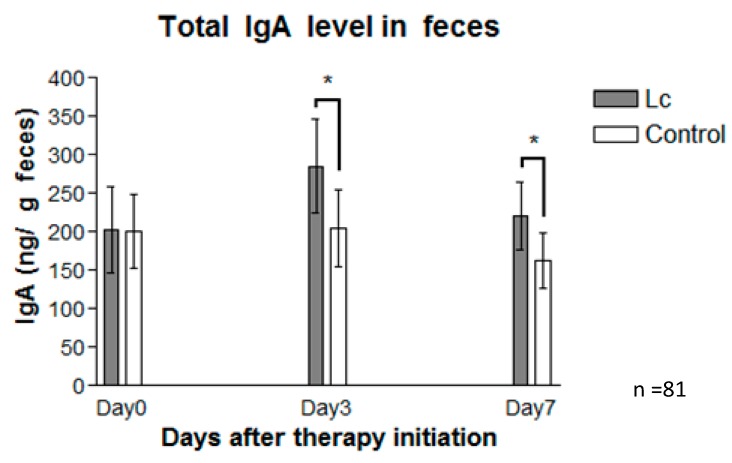
Figure 5.
IgA values (described as ng/g feces) from fecal samples of the probiotic group (gray bar), and the control group (white bar) collected on Days 0, 3, and 7 after therapy was initiated. Fecal samples of patients prescribed with probiotics (Lactobacillus casei variety rhamnosus) produced a significantly higher level of total IgA than those of the control (placebo). The data are represented as the mean ± SEM (n = 81), and statistically significant differences compared with the control group; * p < 0.05.

