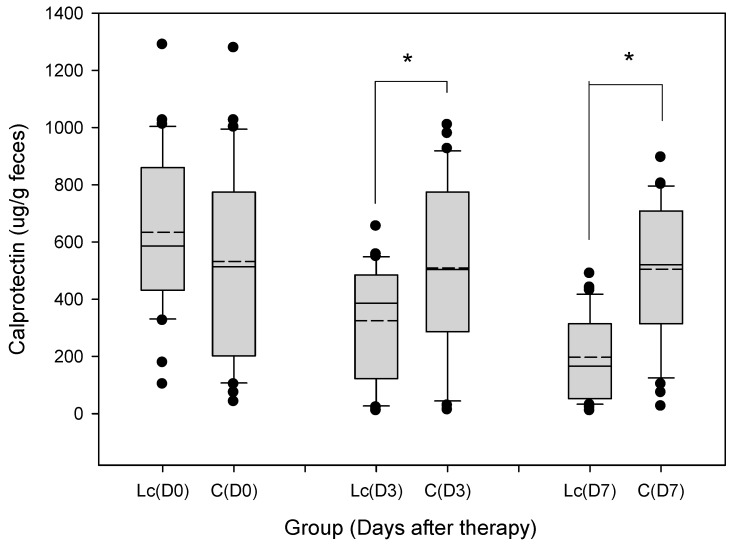
Figure 7.
Grouped samples of fecal calprotectin (μg/g feces) in children prescribed with probiotics (Lactobacillus casei variety rhamnosus) and the control. The figure shows the median, 10th, 25th, 75th, and 90th percentiles as vertical boxes with error bars. The remaining dots represent outliers less than the 10th or more than the 90th percentile. Fecal calprotectin levels were lower in patients with probiotic (Lactobacillus casei variety rhamnosus) consumption than those of the control on Days 3 and 7 (horizontal line: Median; short dash line: Mean; * p < 0.05).

