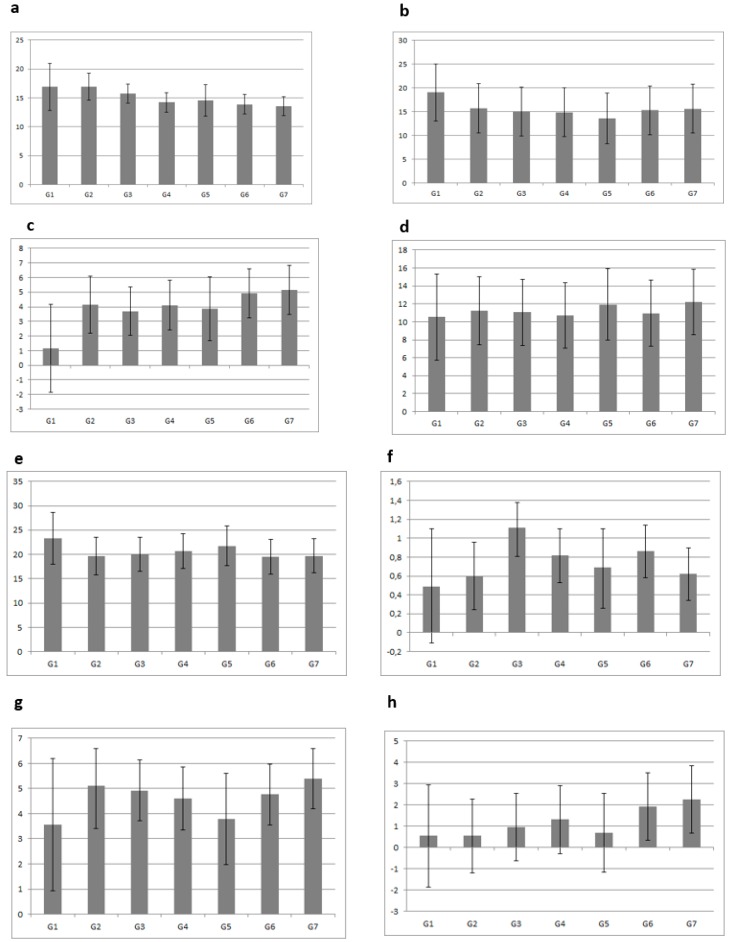
Figure 2.
Marginal means and SD of food and beverage consumption (number of portions per week) according to PA and ST recommendations. G1: met both recommendations at T0 and met both recommendations at T1; G2: met both recommendations at T0 and met one of the recommendations at T1; G3: met one of the recommendations at T0 and met both recommendations at T1; G4: met one of the recommendations at T0 and met one of the recommendations at T1; G5: met one of the recommendations at T0 and did not meet any recommendations at T1; G6: did not meet any recommendations at T0 and met one of the recommendations at T1; G7: did not meet any recommendations at T0 and did not meet any recommendations at T1. Adjusted for maternal education, body mass index z-score at T1, sex, and center. Abbreviations: PA, physical activity; ST, screen time; SD, standard deviation; T0, baseline period; T1, follow-up period; F & V, fruits and vegetables; dairy products (milk, yogurt and cheese); desserts (smoothies, milk-based desserts and sugar desserts); sweets (chocolate and chocolate spreads, cakes, biscuits and pastries); juices (fresh fruit juices and packed juices); fizzy drinks (soft drinks and light drinks). (a) F & V, (b) dairy products, (c) dessert, (d) sweets, (e) water, (f) salty snacks, (g) juices, (h) fizzy drinks.

