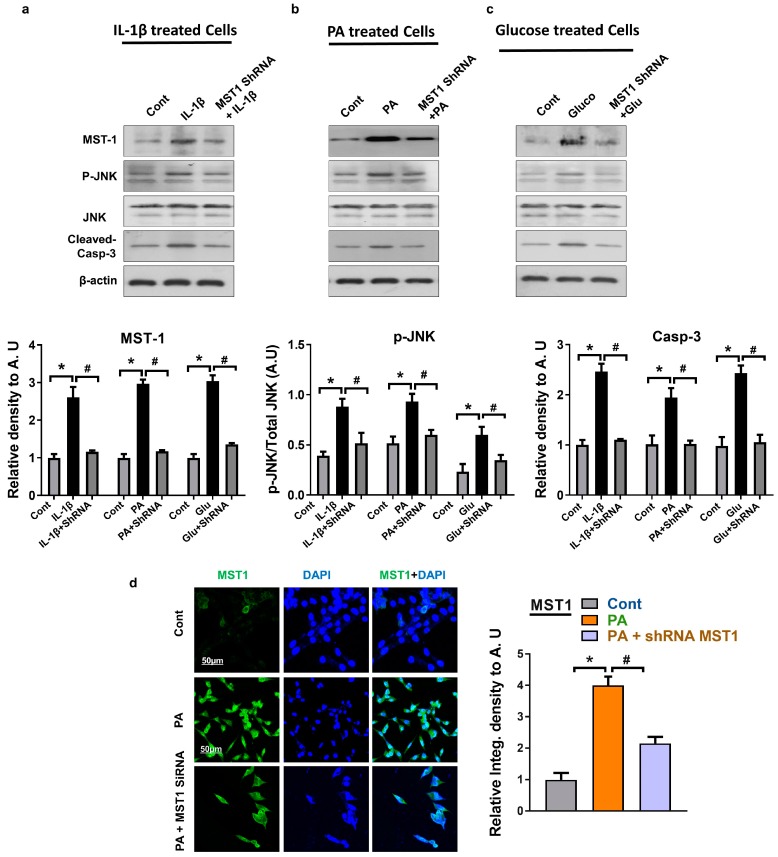
Figure 4.
Effect of shRNA MST1 on JNK/Casp3 in HT22 cells: (a–c) Shown are the Western blot results of MST1, p-JNK, and Cleaved-Casp-3 in IL-1β, palmitic acid, and glucose treated cells HT22 cells. β-actin was used as a loading control. For protein band quantification ImageJ software was used. One-way ANOVA followed by post-hoc analysis was used for statistical analysis. The density values were expressed in arbitrary units (AUs) as the mean ± SEM; (d) given are the representative images of immunofluorescence staining MST1 in PA-treated HT22 cells; the data are expressed as the mean ± SEM. * Significantly different from the control group, and # Significantly different from the stress-induced group; * p < 0.05, # p < 0.05.

