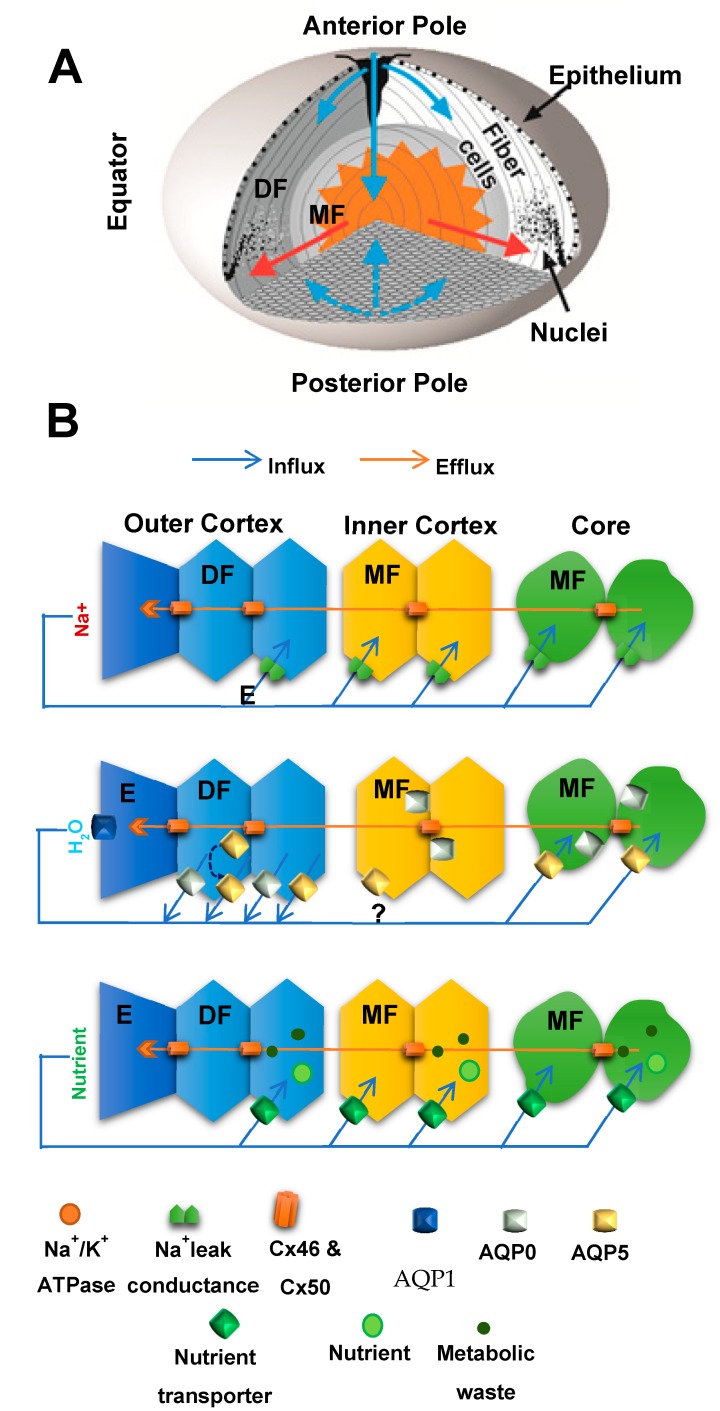
Figure 3.
Lens structure and function (A) 3-D representation of the microcirculation model, showing ions and fluid fluxes that enter the lens at both poles via the extracellular space (blue arrows) before crossing fiber cell membranes and exiting the lens at the equator via an intracellular pathway (red arrows) mediated by gap junctions. (B) Equatorial cross-sections showing how the spatial differences in the distribution of ion channels and transporters between the epithelium (E), differentiating (DF) and mature (MF) fiber cells that generate the circulating flux of Na+ ions (top) that drives isotonic fluid fluxes (middle) which in turn deliver nutrients to and remove metabolic waste from the MF cells (bottom).

