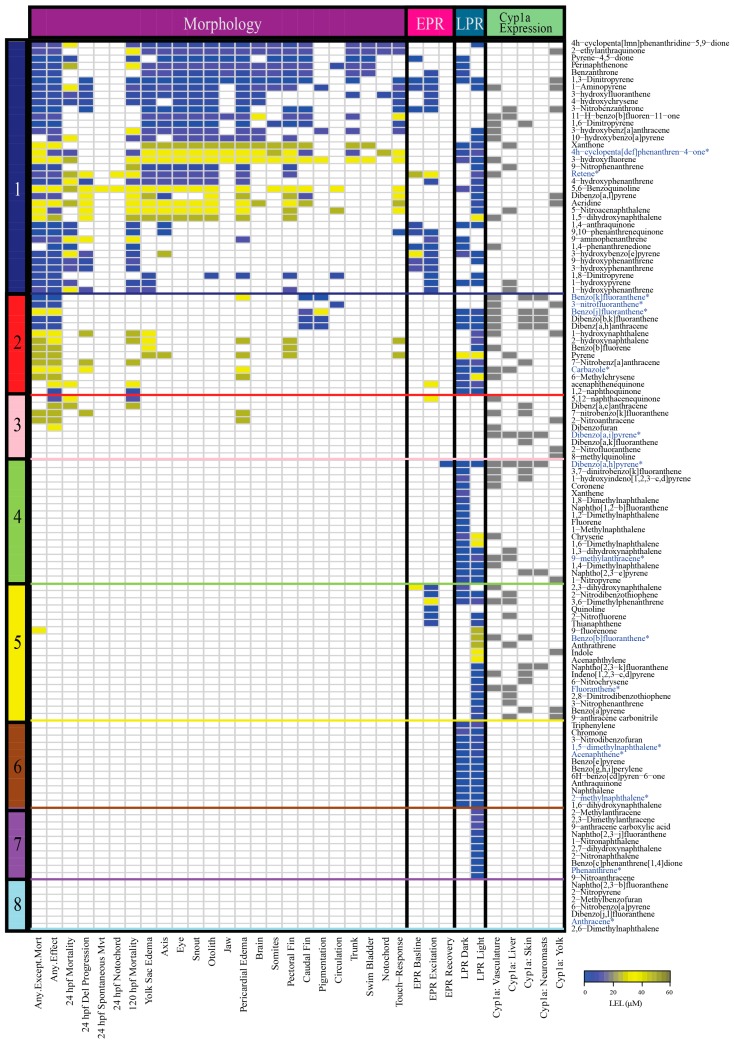
Figure 1.
Heatmap of the morphological and behavioral responses, and Cyp1a protein localization patterns of 123 PAHs assessed using the embryonic zebrafish model. Figure illustrates the developmental toxicity (LEL) across four assays: (1) Morphology (22 endpoints) (2) Embryonic photomotor response (EPR) at 24 hpf (3) Larval photomotor response (LPR) at 120 hpf (4) Cyp1a protein expression in five tissue types. The color bar on the left side of the heatmap denotes the bins of the PAHs. The colors of the cells represent the LEL for each endpoint for each PAH. Gray denotes presence of Cyp1a expression in the specific tissue type. PAHs that were chosen from each bin for RNA sequencing analyses are denoted in blue and an asterisk. Abbreviations: Del = Delayed, Mvt = Movement, hpf = hours post fertilization.

