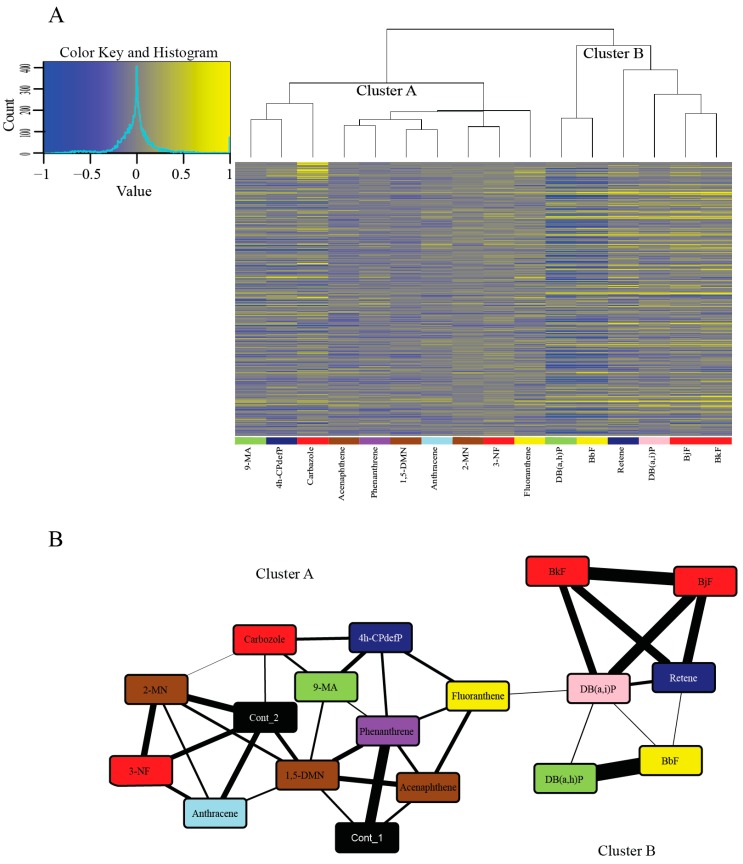
Figure 3.
Hierarchical clustering and network analysis for the 16 PAHs. (A) Hierarchical clustering of the DEGs of the 16 PAHs compared to the control samples. Genes with elevated expression are in yellow and genes with reduced expression are in blue. Genes were ranked by the coefficient of variation and only the top 500 genes are included in the heatmap. (B) Network inferred using the Context Likelihood of Relatedness (CLR) program that links the 16 PAHs based on coordinated transcription of genes as they respond to each PAH. The nodes in the network are specific PAHs, with the colors representing the developmental toxicity bins they belong to. The two controls (in black) are included in the figure. The connectors are similarity of transcriptome response to those PAHs. The thicker the connector, the more similar the response of the PAHs. To produce a more relevant network, only the top 500 genes based on coefficient of variation (CV) was used. Abbreviations: Cont = Control.

