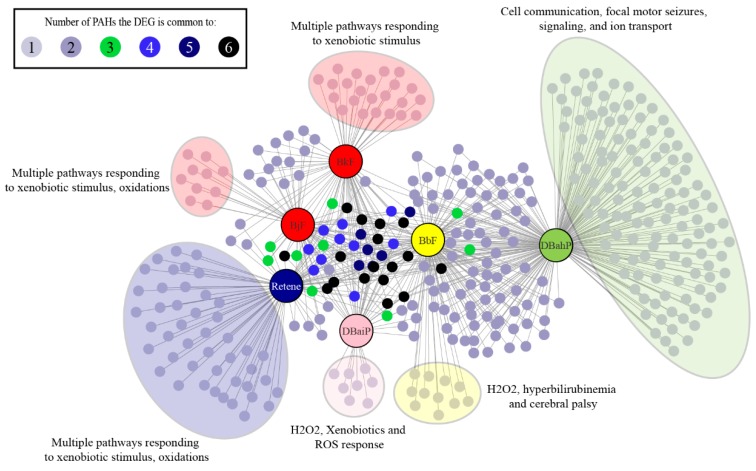
Figure 5.
Unique DEGs (FC >1.5, adjusted p-value <0.05) and pathways associated with each of the six cluster B PAHs. Each cluster B PAH had DEGs associated with one to six of the other Cluster B PAHs. Each PAH also had several unique DEGs represented within the large colored clouds. The figure highlights the most significant pathways associated with each PAH.

