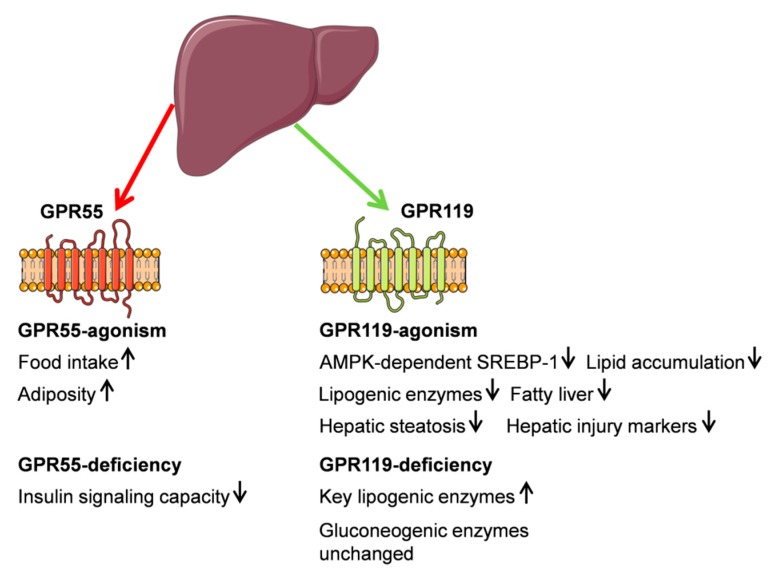
Figure 2.
Schematic illustration of G protein-coupled receptor (GPR) function in liver metabolism. (↑) and (↓) define up or down regulation. Most findings were generated in rodent models. This figure was prepared using a template on the Servier Medical Art website (Available at: http://smart.servier.com/).

