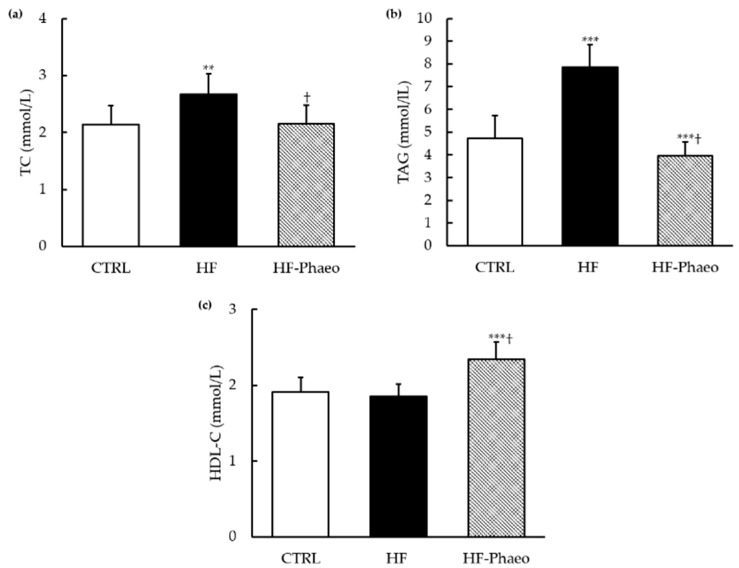
Figure 1.
TC (a), TAG (b) and HDL-C (c) of the control animals, HF animals and HF animals that received P. tricornutum. CTRL, control group; HF, high-fat group; HF-Phaeo, high-fat group supplemented with P. tricornutum; HDL-C, high-density lipoprotein; TC, total cholesterol; TAG, triacylglycerol. Values are means (n = 6), with standard deviations represented by vertical bars. Mean values were significantly different from those of the CTRL group: ** p < 0.001; *** p < 0.0001 (one-way ANOVA; LSD post hoc test). † Significant difference compared with the HF group (p < 0.05).

