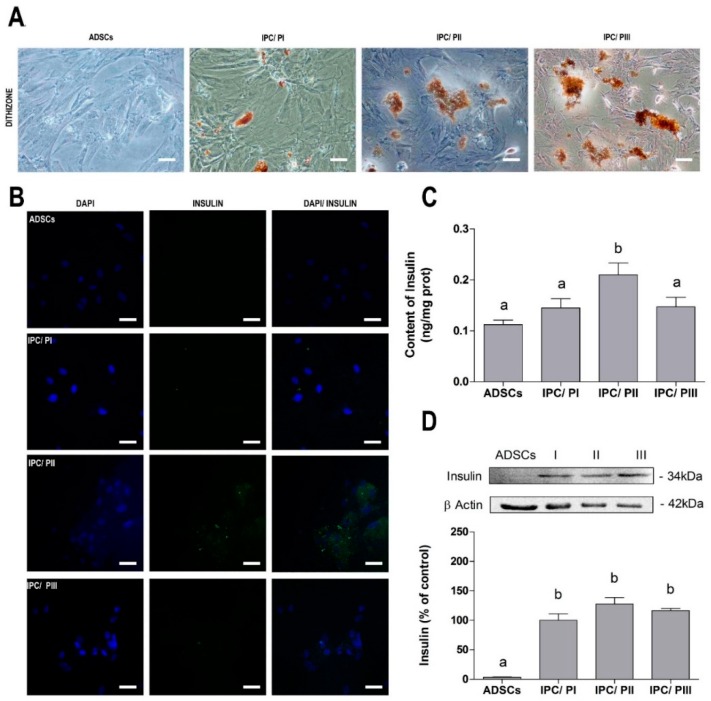
Figure 2.
Differentiation of ADSCs into insulin-producing cells (IPCs). (A) Dithizone (DTZ) staining for indirect insulin assessment at 20× magnification by phase-contrast microscopy. Scale bar = 60 µM; (B) immunofluorescence for insulin (green) and DAPI nuclear staining (blue), at 40× magnification by confocal microscopy. Scale bar = 30 µM; (C) insulin content, measured by ELISA; and (D) pro-insulin content, evaluated by Western blotting. Data are expressed as means ± SE of 6 independent experiments performed in triplicate. Letters indicate different statistical groups by ANOVA followed by Tukey’s test, assuming p < 0.05.

