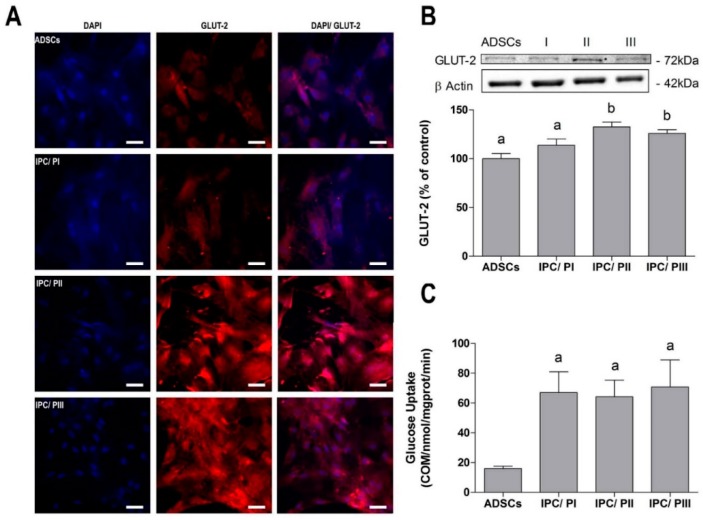
Figure 3.
Evaluation of glucose transport in IPCs. (A) Immunofluorescence for GLUT-2 glucose transporter (red) and DAPI nuclear staining (blue), at 40× magnification by confocal microscopy. Scale bar = 30 µM; (B) evaluation of GLUT-2 expression by Western blotting; and (C) evaluation of glucose uptake of 0.1 μCi/mL [2,3-3H] deoxy-d-glucose. Data are shown as means ± SE of 6 independent experiments performed in triplicate. Letters indicate different statistical groups by ANOVA followed by Tukey’s test, assuming p < 0.05.

