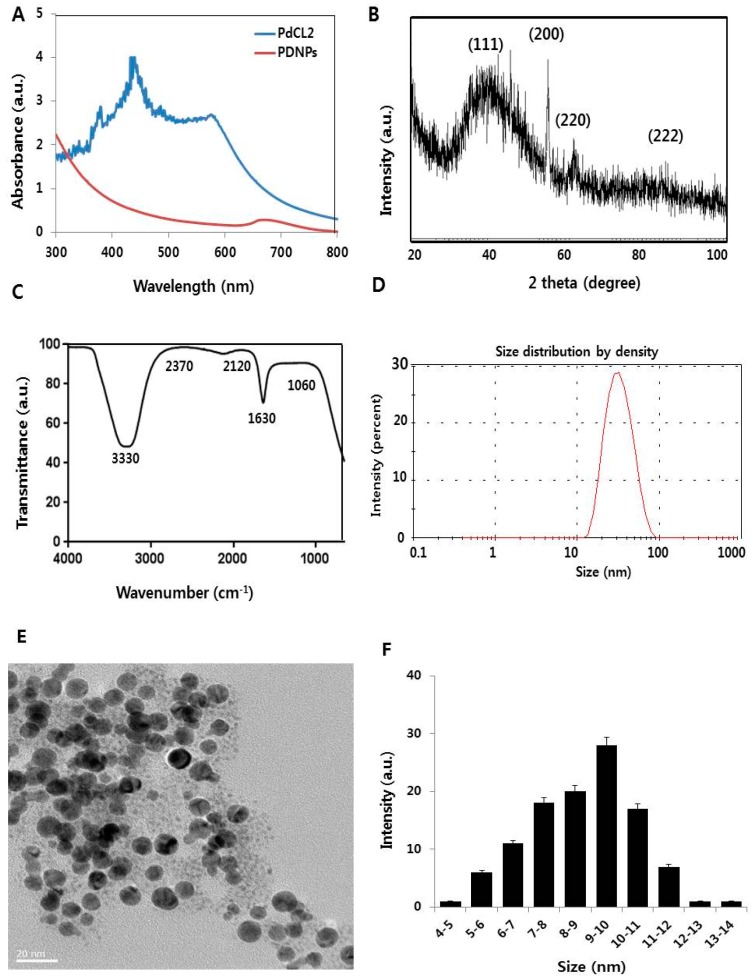
Figure 1.
Synthesis and characterization of palladium nanoparticles (PdNPs). (A) Ultraviolet-visible spectra of PdCl2 (blue) and PdNPs (red), and (B) X-ray diffraction (XRD) pattern of PdNPs. (C) Fourier-transformed infrared (FTIR) spectra of PdNPs. (D) Size distribution analysis of PdNPs by dynamic light scattering (DLS). (E) Transmission electron microscopy (TEM) images of PdNPs. (F) Size distribution based on TEM images of PdNPs, ranging from 4 nm to 14 nm.

