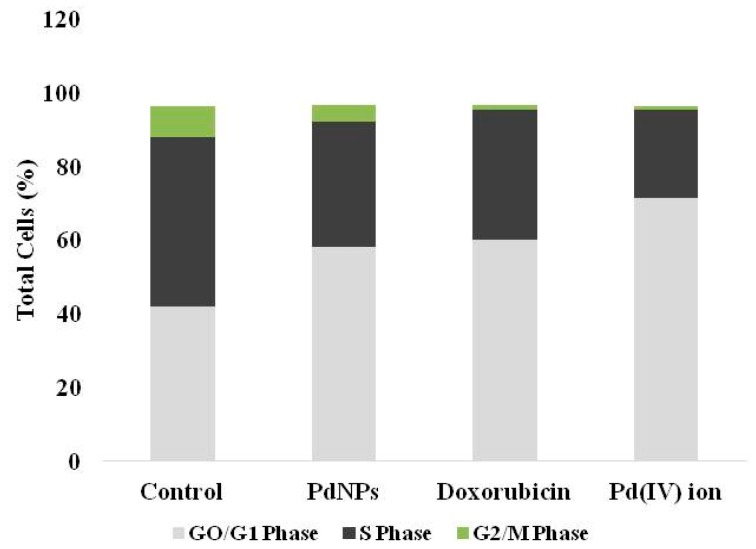
Figure 8.
Cell cycle analysis of SKOV3 cells exposed to PdNPs, doxorubicin and Pd(IV) ion. The cells were treated with 2.5 µg/mL of PdNPs, doxorubicin, and Pd(IV) ion and for comparison, an equal volume of vehicle was used in parallel cultures. The proportion of cells in the different phases was quantitated and represented with partitioned bars as the average of three experiments. G0/G1-phase: light grey; S-phase: dark grey; G2/M phase: green.

