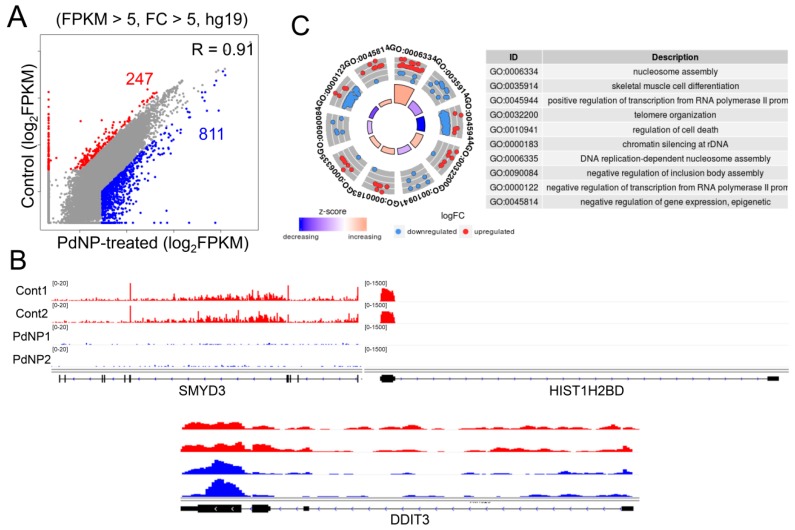
Figure 9.
Palladium nanoparticle (PdNPs) exposure alters gene expression. (A) Scatter plot showing the downregulated (red dots) and upregulated (blue dots) genes after PdNPs exposure. Cutoff: FPKM > 5 and fold change (FC) > 5. (B) Integrative Genomics Viewer (IGV) images showing representative down- and upregulated genes. (C) GO-plot image of GO term analysis for all the differentially expressed genes (DEGs). Red dots and blue dots represent down- and upregulated genes, respectively. FPKM, fragments per kilobase of transcript, per million mapped reads.

