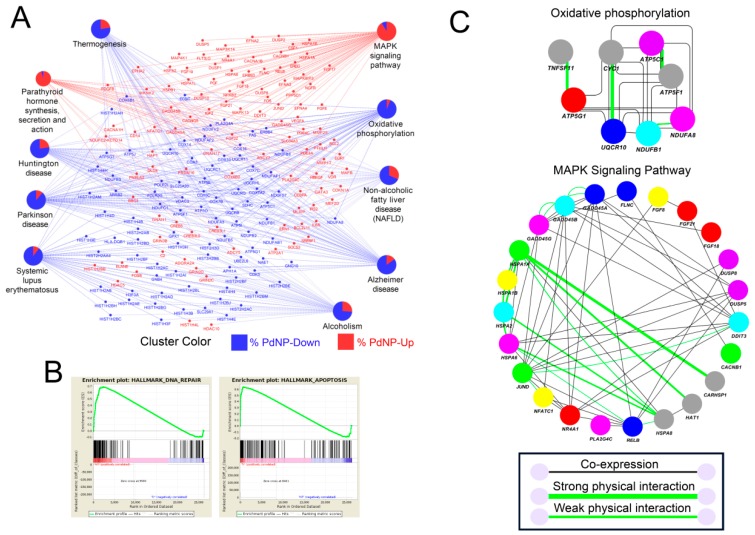
Figure 11.
Pathway analysis reveals the dysregulated expression of apoptosis-inducing genes. (A) Kyoto Encyclopedia of Genes and Genomes (KEGG) analysis showing interconnected genes in the biological pathways. Red and blue colors represent genes respectively up- and downregulated by palladium nanoparticles (PdNPs). (B) Gene set enrichment analysis (GSEA) showing enriched pathways with both up- and downregulated genes. Note that DNA repair and apoptosis pathways were both detected within the differentially expressed genes (DEGs). (C) GeneMANIA analysis showing the gene co-expression network (grey lines) and protein–protein interactions (light green lines) in the KEGG pathways (oxidative phosphorylation and MAPK signaling pathway).

