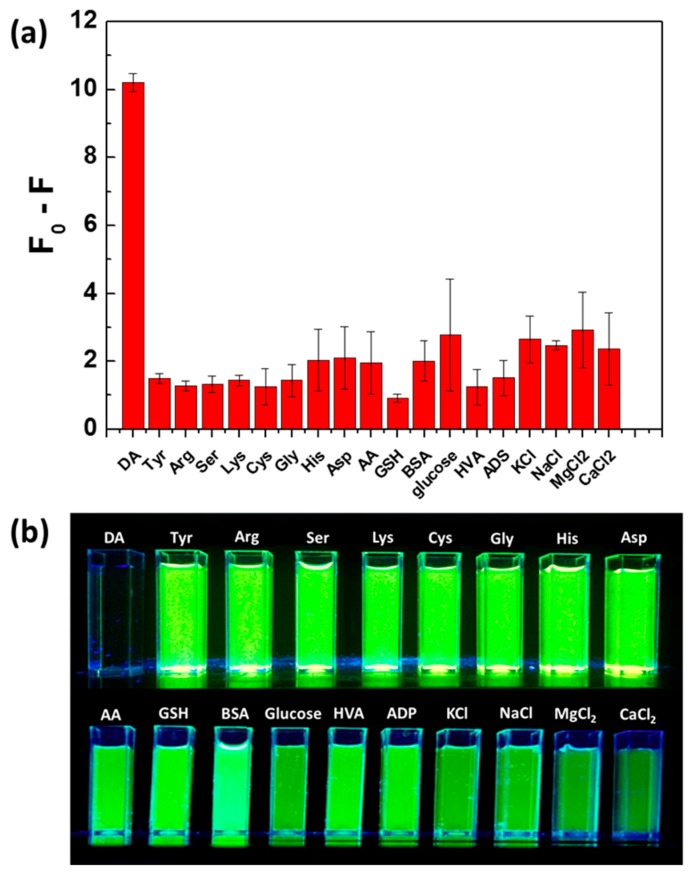
Figure 5.
(a) QDs@MIP response toward DA and various potential interfering substances. QDs@MIP particles were used at a concentration of 4.3 ng/mL while DA and other substances were used at a 26.3 μM concentration. F0 and F are the PL intensities of QDs@MIP particles before and after adding DA or the potential interfering substances, respectively. (b) Digital photograph taken under UV light irradiation of PBS dispersions of QDs@MIPs after adding DA or the potential interfering substances (contact time of 40 min).

