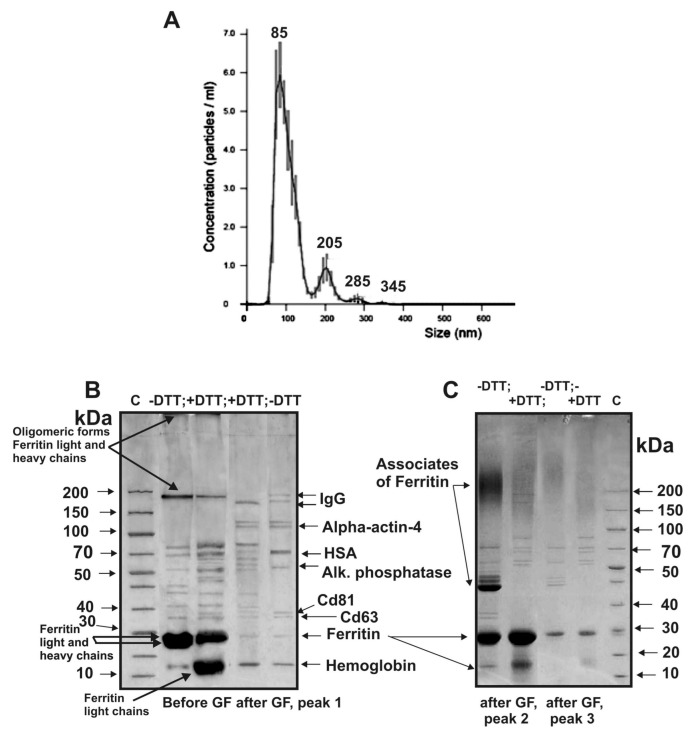
Figure 5.
Nanoparticle tracking analysis of exosomes size after preparation gel filtration using Nanosight NS300 equipment (A). SDS-PAGE analysis of the intrinsic proteins of exosome preparation exo-1 after its filtration though filters 0.1 μm, but before FPLC gel filtration (B; two first lanes: –DTT and +DTT) as well proteins of exosome peak 1 after gel filtration (B; two second lanes: –DTT and +DTT). Analysis of impurity proteins corresponding to peaks 2 and 3 (Figure 1A) after gel filtration of exo-1 preparation (C; –DTT and +DTT lanes). Lanes C correspond to control proteins with known MMs (B and C). Identification of proteins was performed using MALDI mass MS and MS/MS data of proteins hydrolysates corresponding to the protein bands after SDS-PAGE; identified proteins are listed in B and C.

