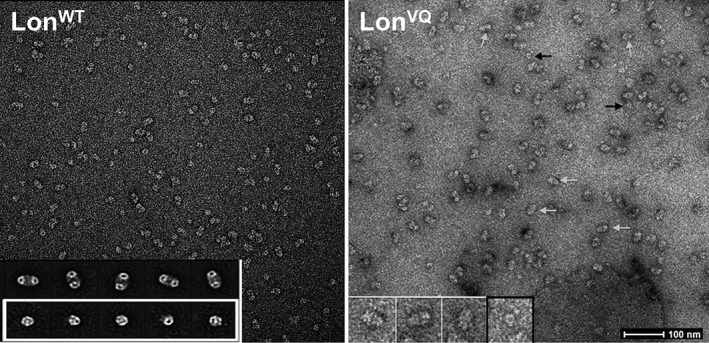
Figure 3.

Electron microscopy analysis and quantification of LonVQ dodecamer formation. Negative stain electron micrographs of LonWT (left) and LonVQ (right). Under the same experimental conditions and upon immobilization on the grids, LonVQ forms a higher percentage of dodecamers. Representative dodecamer and hexamer particles are denoted with white and black arrows, respectively. Inset left: representative class images of dodecamers (top) and hexamers (bottom) based on the LonWT negative stain particles.20 Inset right: zoomed in view of raw LonVQ particles. The three particles on the left in white boxes are dodecamers and the particle on the right in the black box is a representative hexamer. Scale bar shown represents 100 nm.
