Figure 4.

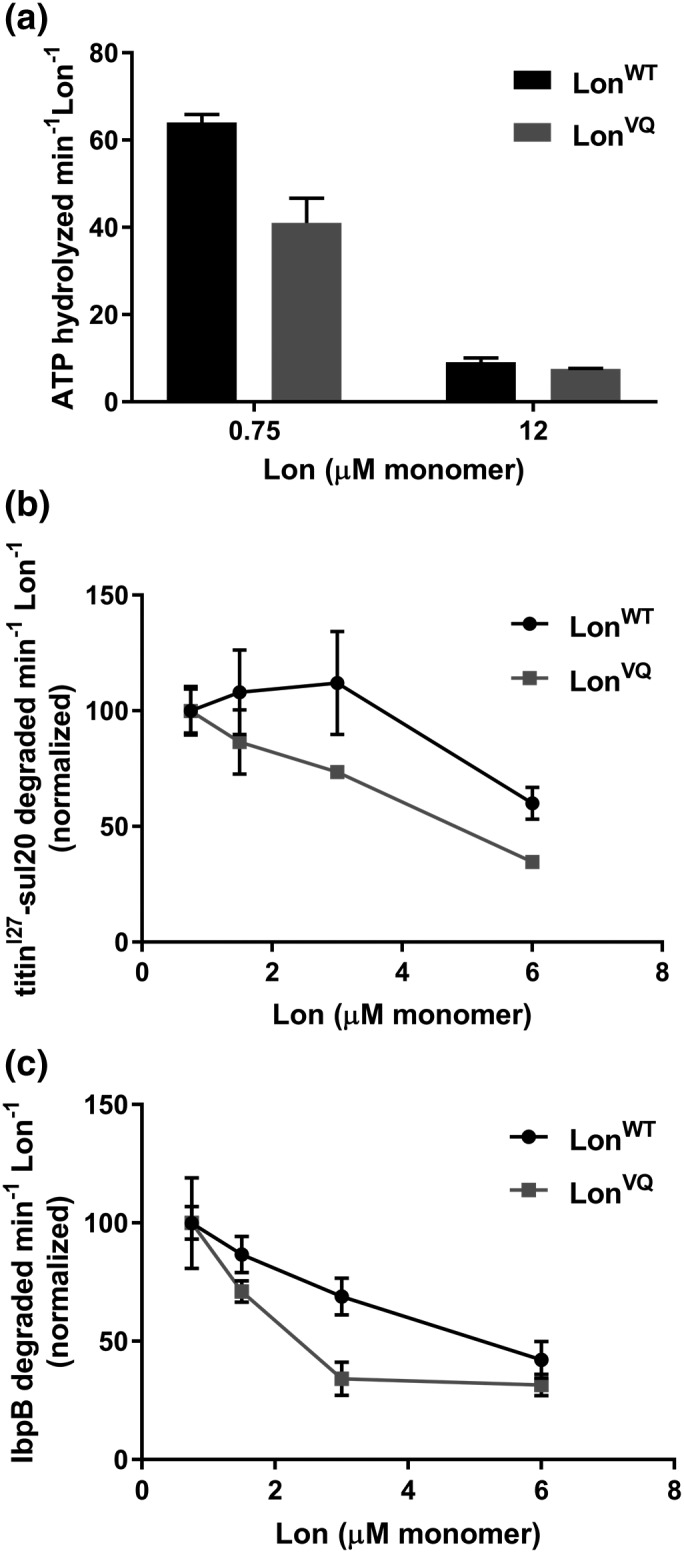
LonVQ displays diminished ATPase and degradation activity compared with LonWT. (a) ATP hydrolysis activity of LonWT (dark gray bars) and LonVQ (light gray bars). At lower concentrations where LonWT is predominately hexameric, there is approximately 1.5‐fold higher activity for LonWT compared with LonVQ. However, at higher concentrations where both proteins are expected to be predominantly dodecamer, the ATP hydrolysis activity is comparable. The values reported are from three independent experiments performed in triplicate, and the error bars represent SEM. (b and c) Degradation of 40 μM 35S‐titinI27‐sul20 (b) and 35S‐IbpB (c) by LonWT and LonVQ was monitored by generation of acid‐soluble radioactive peptides. The indicated Lon concentrations are in monomer equivalents. Degradation rates were normalized in comparison to the rate at 0.75 μM. Each experiment was performed in triplicate and error bars represent SEM (curved lines connecting data points do not represent statistically‐based fitting).
