Figure 1.
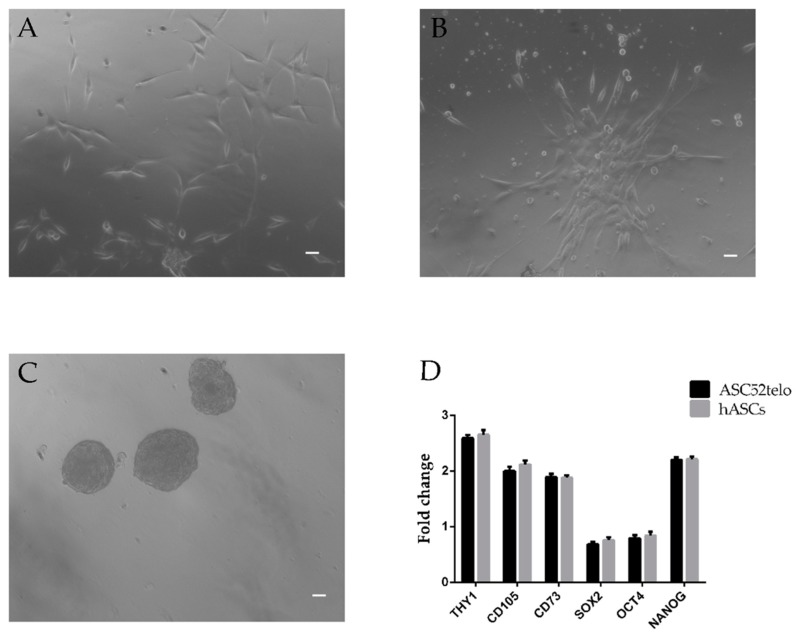
hASC morphology on day 5 (A) of expansion culture observed under light microscopy (10×) with phase contrast with a Nikon DS-FI1 CCD camera. Scale bar = 10μm. (B) Shows the formation of hASC colonies when cultured in adhesion, Scale bar = 10μm, while (C) shows spheres which formed when hASCs were cultured in low adhesion culture conditions, Scale bar = 10μm. A representative experiment referring to 23 samples studied. (D) qRT-PCR analysis in freshly isolated hASCs at passage 4 of THY1, CD73, CD105, OCT4, SOX2 and NANOG gene expression compared to ASC52telo, hTERT immortalized adipose-derived mesenchymal stem cells. Data shown are relative to an endogenous control (beta-Actin). Relative expression levels were assessed using the 2−ΔΔCt method. Values are shown as the mean ± SE. Data are representative of three independent experiments.

