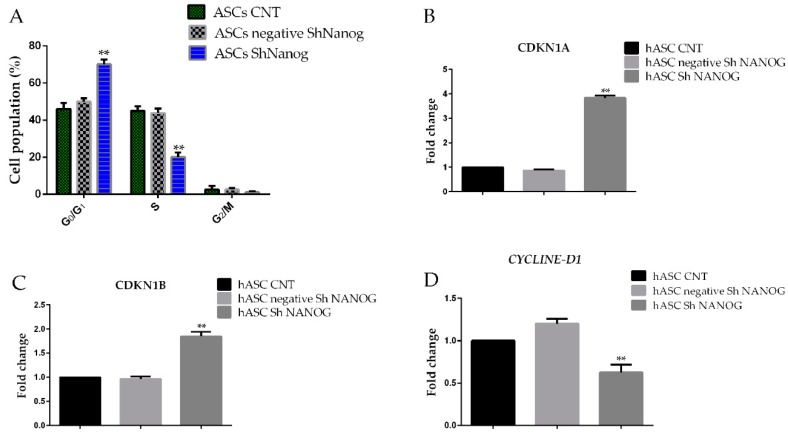
Figure 5.
Changes in hASCs cell cycle distribution as a result of NANOG downregulation. (A) Shows cell cycle distribution of hASCs according to Nicoletti’s protocol. (B) and (C) Real-time PCR analyses showed that expression of the cell cycle protein CDKN1A and CDKN1B were significantly increased in hASCs with NANOG downregulated while the expression of CYCLINE D1 was downregulated (D). Flow cytometry analyses showed that downregulation of NANOG induced a decrease in the proportion of G2/M + S phase cells in hASCs sh NANOG as compared to freshly isolated hASCs at passage 4 (hASCs CNT). All experiments were repeated at least three times. (Values are mean ± SD, ** p < 0.01).

