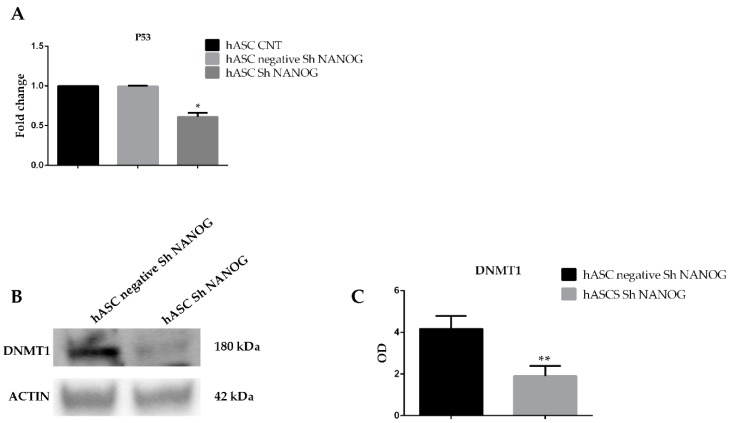
Figure 6.
(A) qRT-PCR of p53 gene expression in in freshly isolated hASCs at passage 4 (hASCs CNT), hASCs lentivirally transducted with scrambled (negative) and shRNA against NANOG (hASCs sh NANOG). p53 gene expression was significantly downregulated following inhibition of NANOG in hASCs. Relative expression levels were assessed using the 2−ΔΔCt method. Data are representative of three independent experiments with the fold change compared to expression levels in a commercial human adipose stem cell line (ASC52telo, hTERT immortalized adipose-derived mesenchymal stem cell). The experiment was repeated at least three times * p < 0.05. (B) Representative western blot analysis for expression of DNMT1. Densitometric analysis of the Western blot depicted in (C). The histograms are the results of three independent experiments. The values are shown as the mean ± SE, ** p < 0.01. OD, optical density (** p < 0.01).

