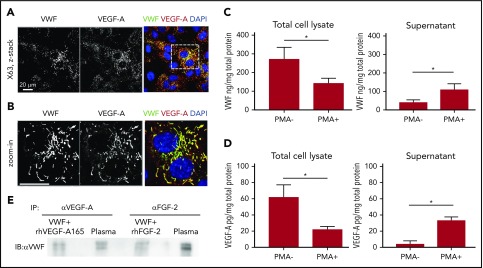
Figure 3.
VWF and GF colocalize in ECs and interact in human plasma. (A) Representative high-magnification immunofluorescence images of VWF (green) and VEGF-A (red) expression in the wound, shown as single grayscale channels, in HUVECs; nuclei are identified by DAPI (blue). The white box identifies zoom area shown in (B). Scale bar = 20 μm. (C) VWF was quantified by ELISA in total HUVEC lysates (left) or in cell culture supernatants (right) in the presence or absence of phorbol myristate acetate (PMA) stimulation. Data expressed as ng/mg are normalized to total protein levels (mg) (n = 4; data are mean ± SEM). (D) VEGF-A was quantified by ELISA in total HUVEC lysates (left) or in cell culture supernatants (right) in the presence or absence of PMA stimulation. Data expressed as pg/mg are normalized to total protein levels (mg) (n = 4; data are mean ± SEM). (E) Human plasma or positive control (recombinant VWF + recombinant VEGF-A or FGF-2) was subjected to immunoprecipitation with anti-human VEGF-A antibody or anti-human FGF-2 antibody. Western blotting was performed with collected proteins using anti-human VWF antibody. Mann-Whitney U test was used for analysis. *P < .05.

