Figure 2.
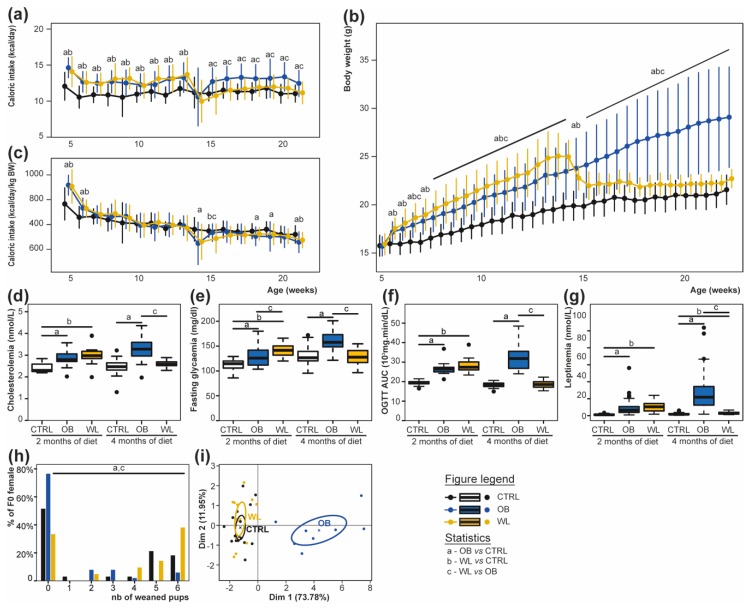
OB dams develop obesity, dyslipidaemia and diabetes and preconceptional WL normalises these parameters. F0 mice were monitored for caloric intake in kcal/day (a), body weight (b), or kcal/day/kg body weight (c), CTRL, n = 20–40; OB, n = 24–72; and WL, n = 12–26, represented as mean ± SD. At 2 and 4 months of preconceptional diet, cholesterolemia (d), fasting glycemia (e), oral glucose tolerance test (f), and leptinemia (g) were recorded, CTRL, n = 12–40; OB, n = 11–72; and WL, n = 11–26, represented as Tukey boxplots (dots: outliers). Percentage of weaned pups per litter is indicated in (h), CTRL, n = 33; OB, n = 51; and WL, n = 21. A Principal Component Analysis on body weight and organ relative weights at sacrifice shows a separation of OB from CTRL and WL dams on dimension 1 (i), CTRL n = 16; OB, n = 8; and WL, n = 12.

