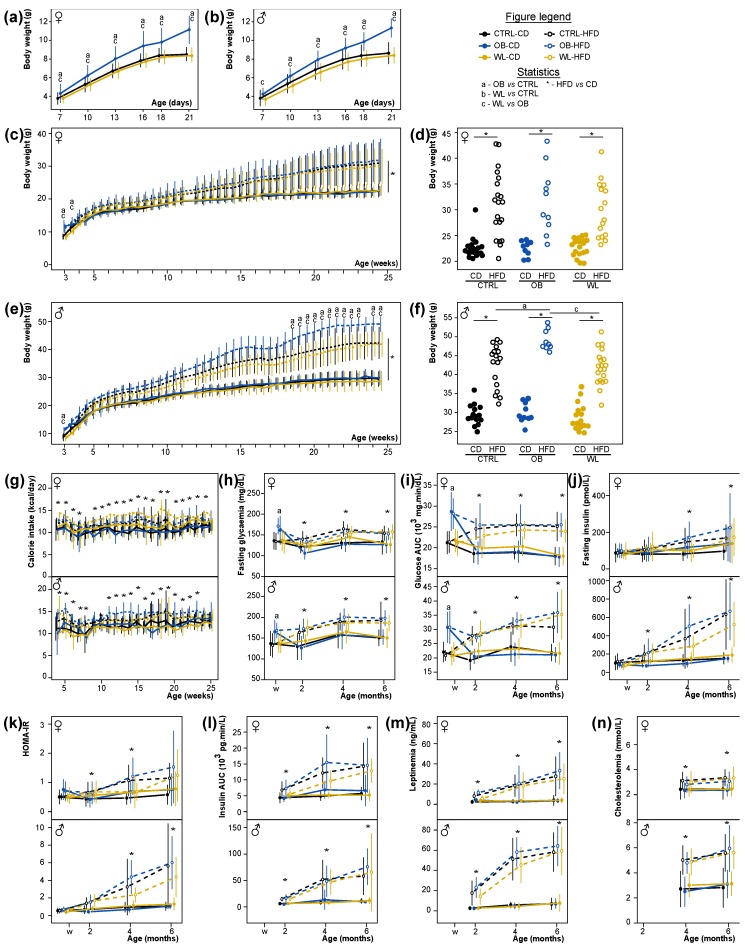
Figure 3.
Male offspring born to OB mothers develop increased diet-induced obesity, WL offspring are not distinguishable from CTRL. F1 weight during the lactation period (a), female and (b), male, n = CTRL F:43, M:36, OB F:20, M:19, WL F:36, M:37) and evolution of body weight from weaning to 6 months of age ((c), female and (e), male, n = CTRL-CD F: 16–20, M: 12–15, CTRL-HFD F: 12–17, M: 13–17, OB-CD F: 7–10, M: 8–11, OB-HFD F: 7–11, M: 7–10, WL-CD F: 15–19, M: 11–17, WL-HFD F: 13–16, M: 14–20). Scatter plot of weight at week 24.5 to illustrate the distribution of the data ((d) females and (f) males). Evolution of food intake after weaning (g), fasting glycemia (h), OGTT glucose AUC (i), fasting insulinemia (j), HOMA-IR (k), OGTT insulin AUC (l), leptinemia (m), cholesterolemia (n) at weaning, 2, 4 and 6 months of age, represented as mean ± SD, n = CTRL-CD F: 13–20, M: 8–16, CTRL-HFD F: 13–21, M: 5–17, OB-CD F: 5–9, M: 8–10, OB-HFD F: 7–10, M: 7–9, WL-CD F: 7–19, M: 5–17, WL-HFD F: 6–17, M: 8–20 depending on age and investigated parameters.

