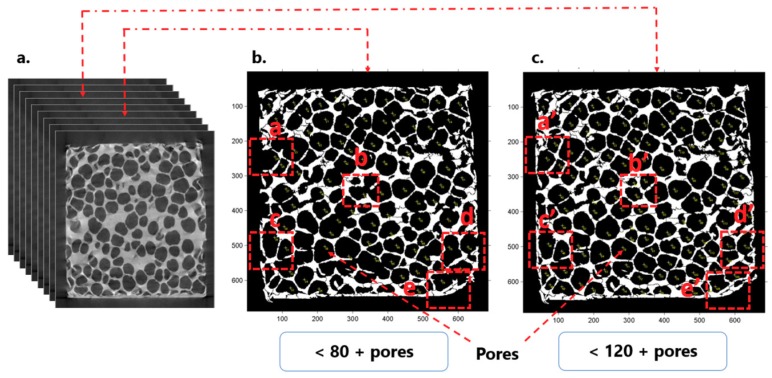
Figure 3.
2D tomography images of the closed-cell aluminum foam samples (Aluhab foam): (a) CT scan images; (b,c) random position images, selected from the range of images generated during CT scanning, showing the differences in pore sizes and arrangements, and cell wall thicknesses throughout the 3D volume of the foam sample.

