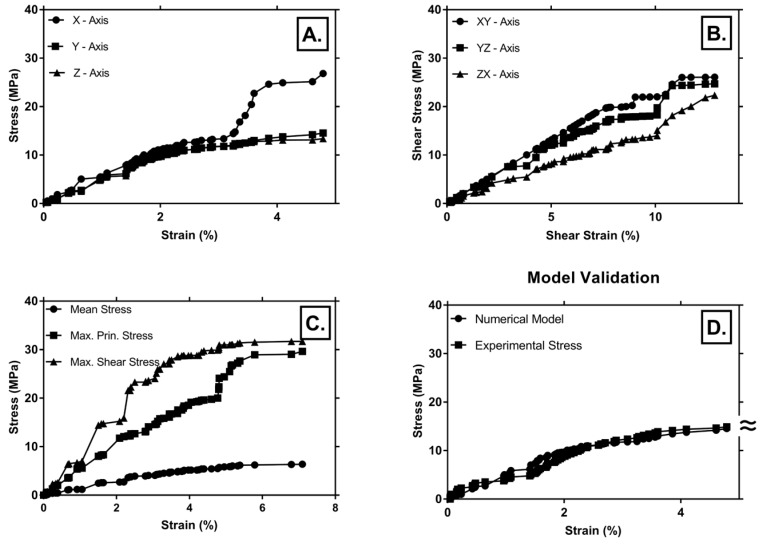
Figure 11.
Stress–strain curves for numerical sample: (A) stresses in x-, y- and z-axis directions as a function of strain; (B) shear stresses in xy, yz and zx directions as a function of strain; (C) maximum principal stress, maximum shear stress, and maximum mean stress, as a function of strain; (D) comparison of stress–strain curves in the case of experimental and numerical tests.

