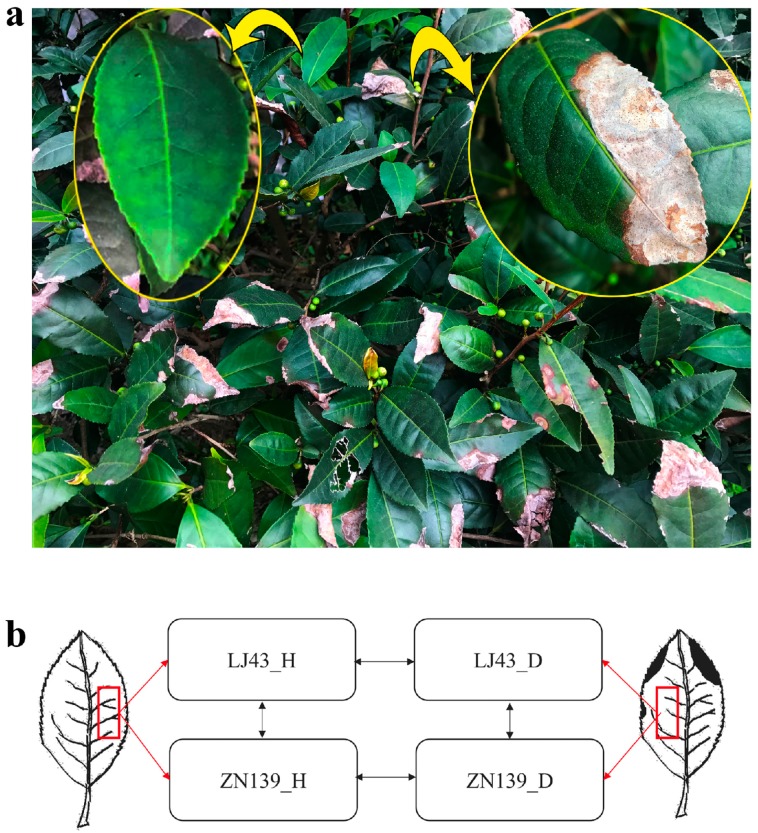
Figure 1.
Sample preparation and experiment scheme. (a) Anthracnose of tea plant occurrence in tea field. Yellow arrow represents healthy leaf (left) and partially enlarged drawing of anthracnose infected leaf (right). (b) A schematic diagram of a healthy leaf (left) and an infected leaf (right). The leaf slices were cut for RNA isolation as described in red boxes. Pairwise comparisons for LJ43 and ZN139 were conducted by arrows. Horizontal arrows mean comparisons between healthy leaves (LJ43_H and ZN139_H) and anthracnose disease infected leaves (LJ43_D & ZN139_D) within cultivar, and the vertical arrow indicates comparisons between cultivars.

