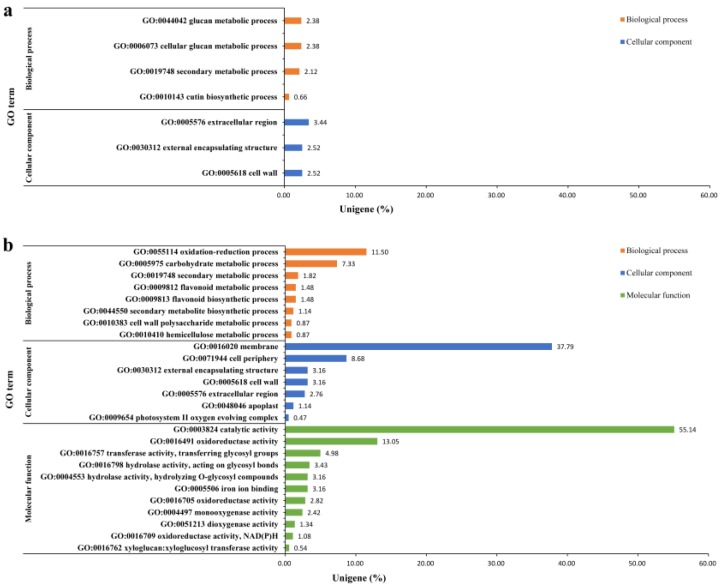
Figure 3.
Gene Ontology (GO) enrichment test of cultivars LJ43 (a) and ZN139 (b). GO terms are divided into three catalogs, i.e., molecular function (green bars), biological processes (orange bars), cellular component (blue bars), which is shown in Y-axis. X-axis shows the percentage of unigenes in all DEGs aligned to the GO database with Corrected p-value (p) < 0.05.

