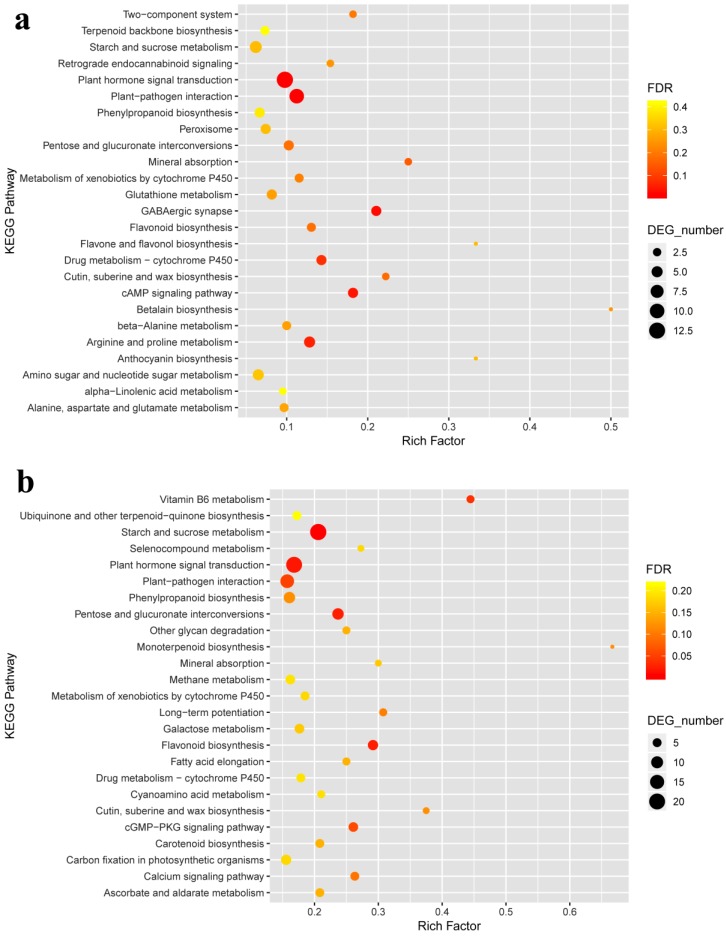
Figure 4.
Kyoto Encyclopedia of Genes and Genomes (KEGG) pathway enrichment bubble chart of LJ43 (a) and ZN139 (b). The Top 25 of pathway enrichment was revealed with low false discovery rate (FDR) (in red colour, significantly) and high FDR (in green colour, insignificantly). X-axis shows the percentage of DEGs in total number of genes involved in corresponding KEGG pathway. Y-axis expresses KEGG pathway. As well, the size of bubble means the number of DEGs in this item.

