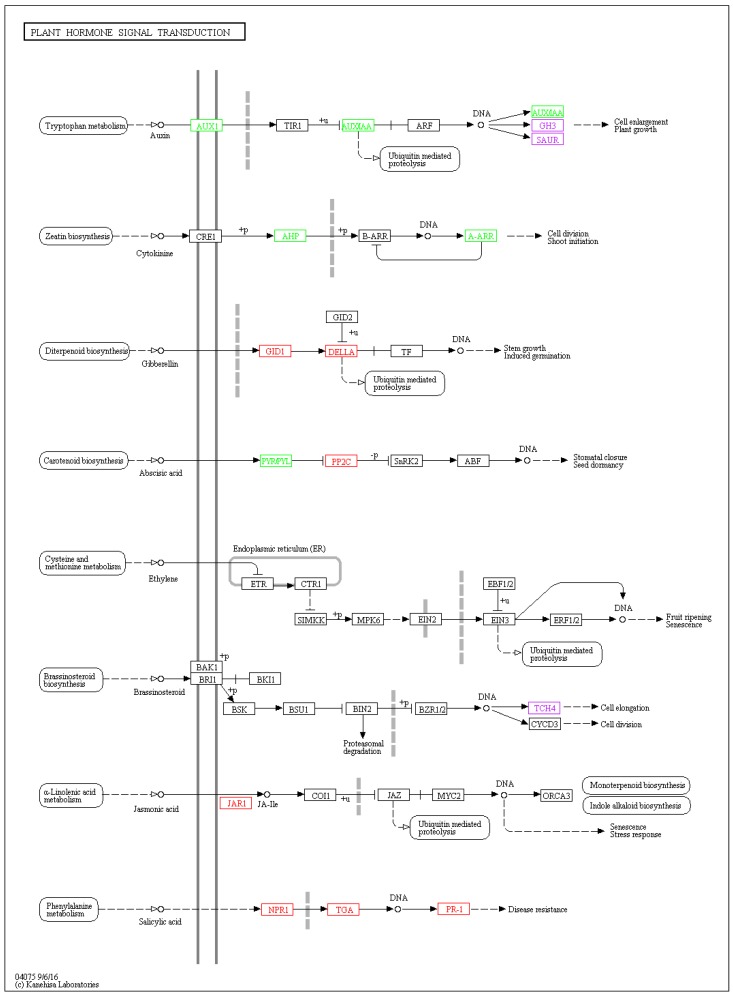
Figure 5.
Visualization of plant hormone signal transduction (ko04075) KEGG pathway for two tea cultivars. The DEGs comparisons of anthracnose infected leaves versus healthy leaves was depicted by boxes in different colors, with red colour representing upregulation, green colour representing downregulation and purple colour representing mixture of upregulation and downregulation. Other boxes mean no DEGs mapping to KEGG ontology terms.

