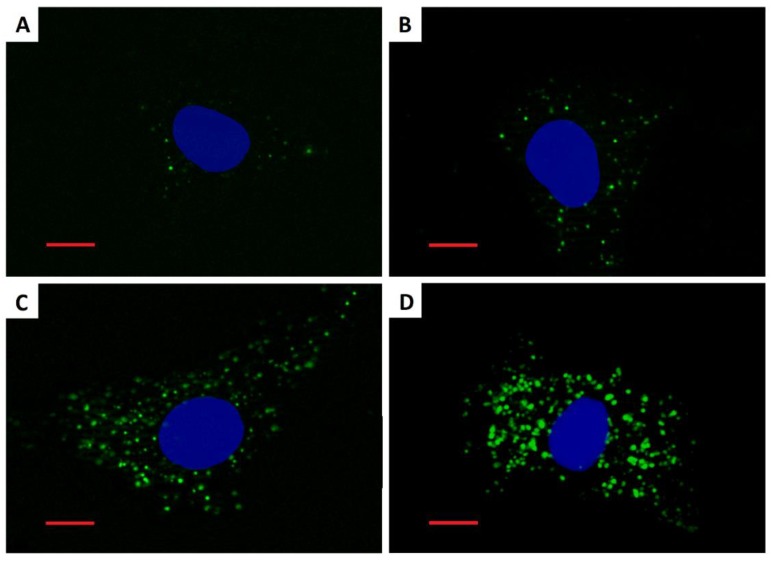
Figure 4.
Fluorescence images of A549 cells stained by the LipidTOX dye after a 48-h incubation. (A) Untreated control cell; (B) cell treated with 20 µg·mL−1 γ-Fe2O3+SiO2-COOH; (C) cell treated with 20 µg·mL−1 γ-Fe2O3+SiO2-NH2; (D) cell treated with 20 µg·mL−1 γ-Fe2O3+SiO2. Green fluorescence represents phospholipid rich organelles. Blue fluorescence represents cell nuclei. Scale bar = 10 µm.

