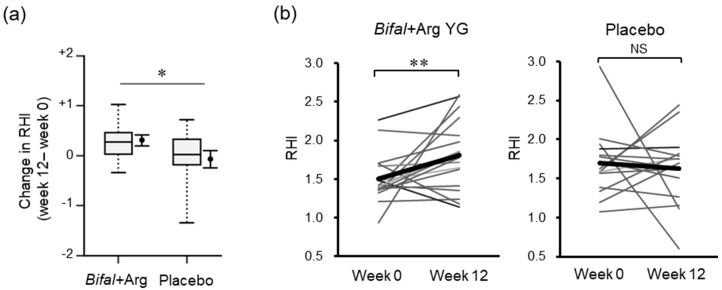
Figure 2.
Effect of the consumption of yogurt containing B. animalis subsp. lactis and Arg (Bifal + Arg YG) on the reactive hyperemia index (RHI). Boxplots represent the 5th percentile, 95th percentile, interquartile range (25–75%), and median. The black circle and error bars on the side of the boxplots represent the average value and SEM, respectively. (a) Change in RHI during the clinical test period (* p < 0.05, baseline × change interaction p = 0.023 by two-way ANOVA). n = 18 in the Bifal + Arg YG group and n = 15 in the placebo group (one outlier in the placebo group at week 12 was detected; Supplementary Figure S3). (b) Change in RHI within each group. The bold line represents the average value. ** p < 0.01 by paired t-test. NS: Not significant. n = 18 in the Bifal + Arg YG group and n = 15 in the placebo group (one outlier in the placebo group at week was detected; Supplementary Figure S3).

