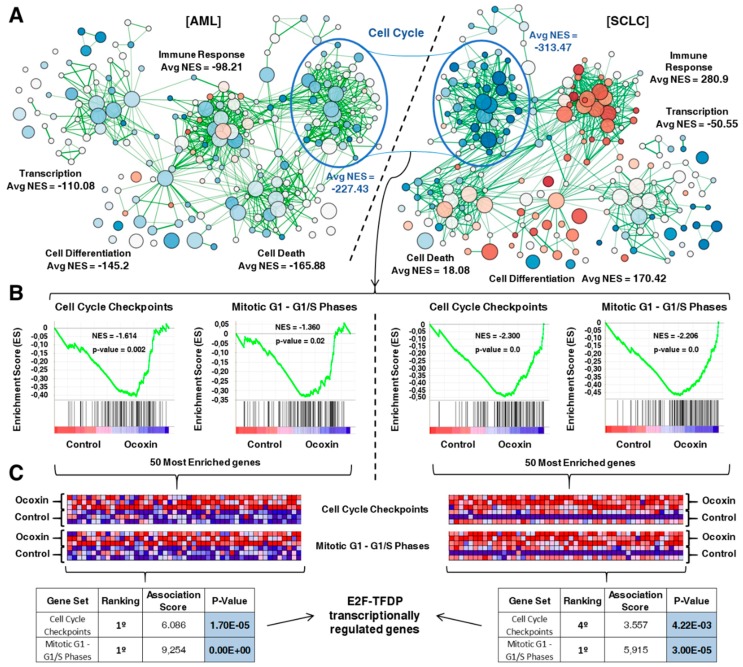
Figure 2.
Functional analysis of transcriptomic alterations caused by OOS. (A). Gene-set enrichment expression network designed using Cytoscape to compare control and OOS-treated cells in our two experimental models, AML (left) and SCLC (right). Several cellular functions were clearly deregulated by OOS. Cell Cycle had the highest average normalized enrichement score (Avg NES) in both tumor models. (B) Enrichment score (ES) profile and location of GeneSet members on the rank-ordered list of the two most deregulated cell cycle GeneSets (“Cell Cycle Checkpoints” and “Mitotic G1-G1/S Phases”) in the AML model (left panels). Both ES profiles behaved very similarly in the SCLC model (right panels). (C) Blue-pink diagram of the 50 most OOS-deregulated genes included in “Cell Cycle Checkpoints” and “Mitotic G1-G1/S Phases”. Overexpressed genes are displayed in shades of pink-red, and downregulated genes in shades of blue. PASTAA online tool results are displayed in the table. The highest association score for three of the four pools of genes analyzed correlated the expression of these genes to the E2F pathway.

