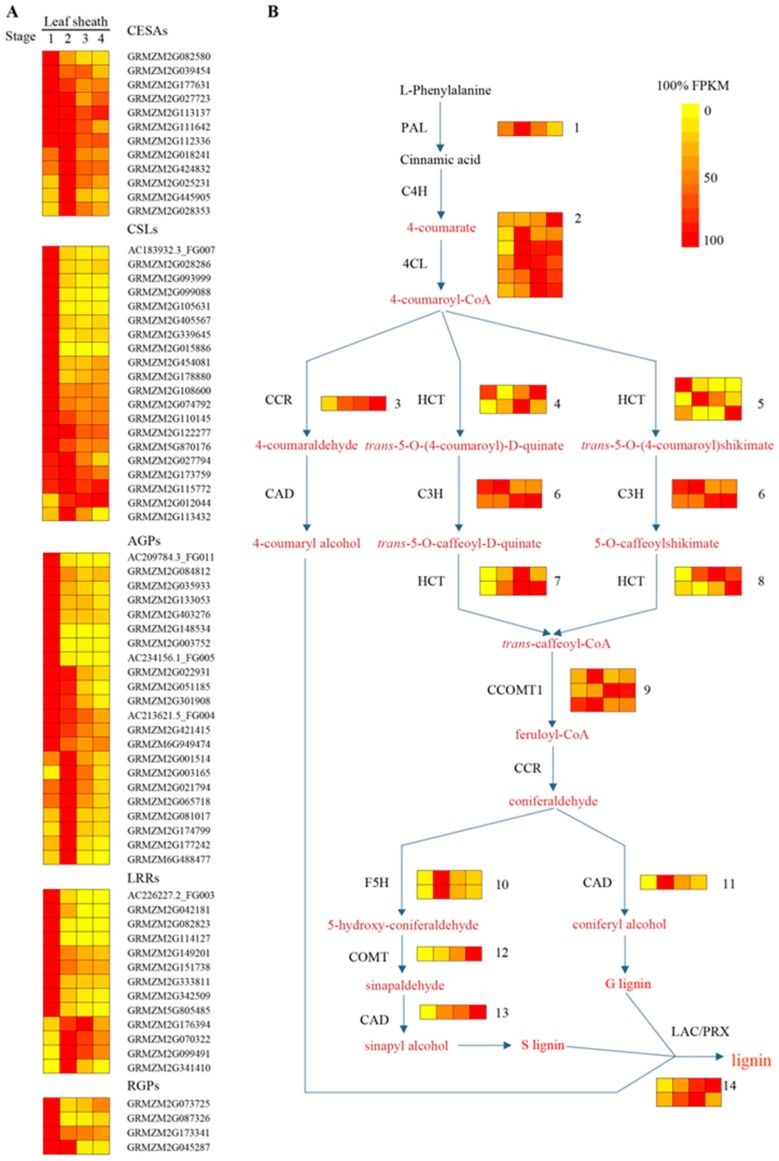
Figure 3.
Heatmaps showing the expression profiles of genes related to cell wall (A) and lignin biosynthesis (B). Relative gene expression was calculated from the maximum fragments per kilobase million (FPKM) values among the maturation zones. The detailed expression patterns and identities of the genes in each of these biosynthetic pathways are shown in Supplementary Table S2.

