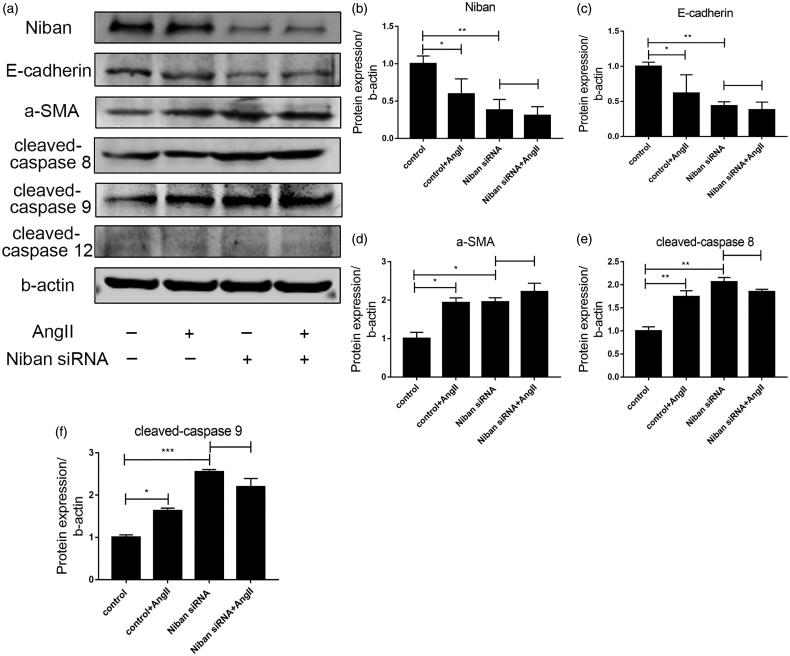
Figure 6.
Effect of silencing the expression of Niban. (a) Western blot detection of protein expression levels of Niban, E-cadherin, α-SMA, cleaved-caspase 8, cleaved-caspase 9, and cleaved-caspase 12 in the control, control + AngII, Niban siRNA, and Niban siRNA + AngII groups. (b–f) Relative expression levels of each protein. *p<.05, **p<.01, ***p<.001.

