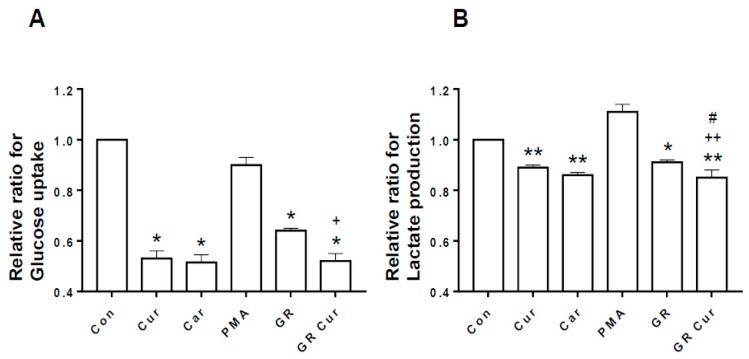
Figure 3.
Effect of curcumin and glucose restriction on glucose uptake and lactate production. HepG2 cells were cultivated under the conditions indicated in the legend of Figure 1, and (A) glucose uptake and (B) lactate production were quantified. Con, standard RPMI-1640 medium; Cur, curcumin; Car, cariporide; PMA, phorbol-12-myristate-13-acetate; GR, glucose restriction, 5.5 mM glucose medium; GR Cur, glucose restriction plus curcumin. Experiment was conducted five times independently. * p < 0.05 vs. control; ** p < 0.01 vs. control; + p < 0.05 vs. GR; ++ p < 0.01 vs. GR; # p < 0.05 vs. Cur.

