Figure 4.
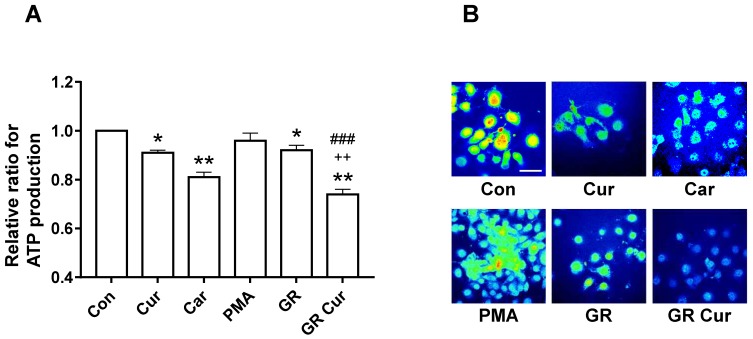
Effect of curcumin and glucose restriction on ATP production. HepG2 cells were cultivated under the conditions indicated in the legend of Figure 1, and (A) ATP production was measured. Experiment was conducted five times independently. (B) Confocal imaging of ATP production in HepG2 cells. High and low ATP concentrations are indicated by bright red and dark blue color, respectively. The scale bar is 50 μm. Con, standard RPMI-1640 medium; Cur, curcumin; Car, cariporide; PMA, phorbol-12-myristate-13-acetate; GR, glucose restriction, 5.5 mM glucose medium; GR Cur, glucose restriction plus curcumin. * p < 0.05 vs control; ** p < 0.01 vs. control; ++ p < 0.01 vs. GR; ### p < 0.005 vs. Cur.

